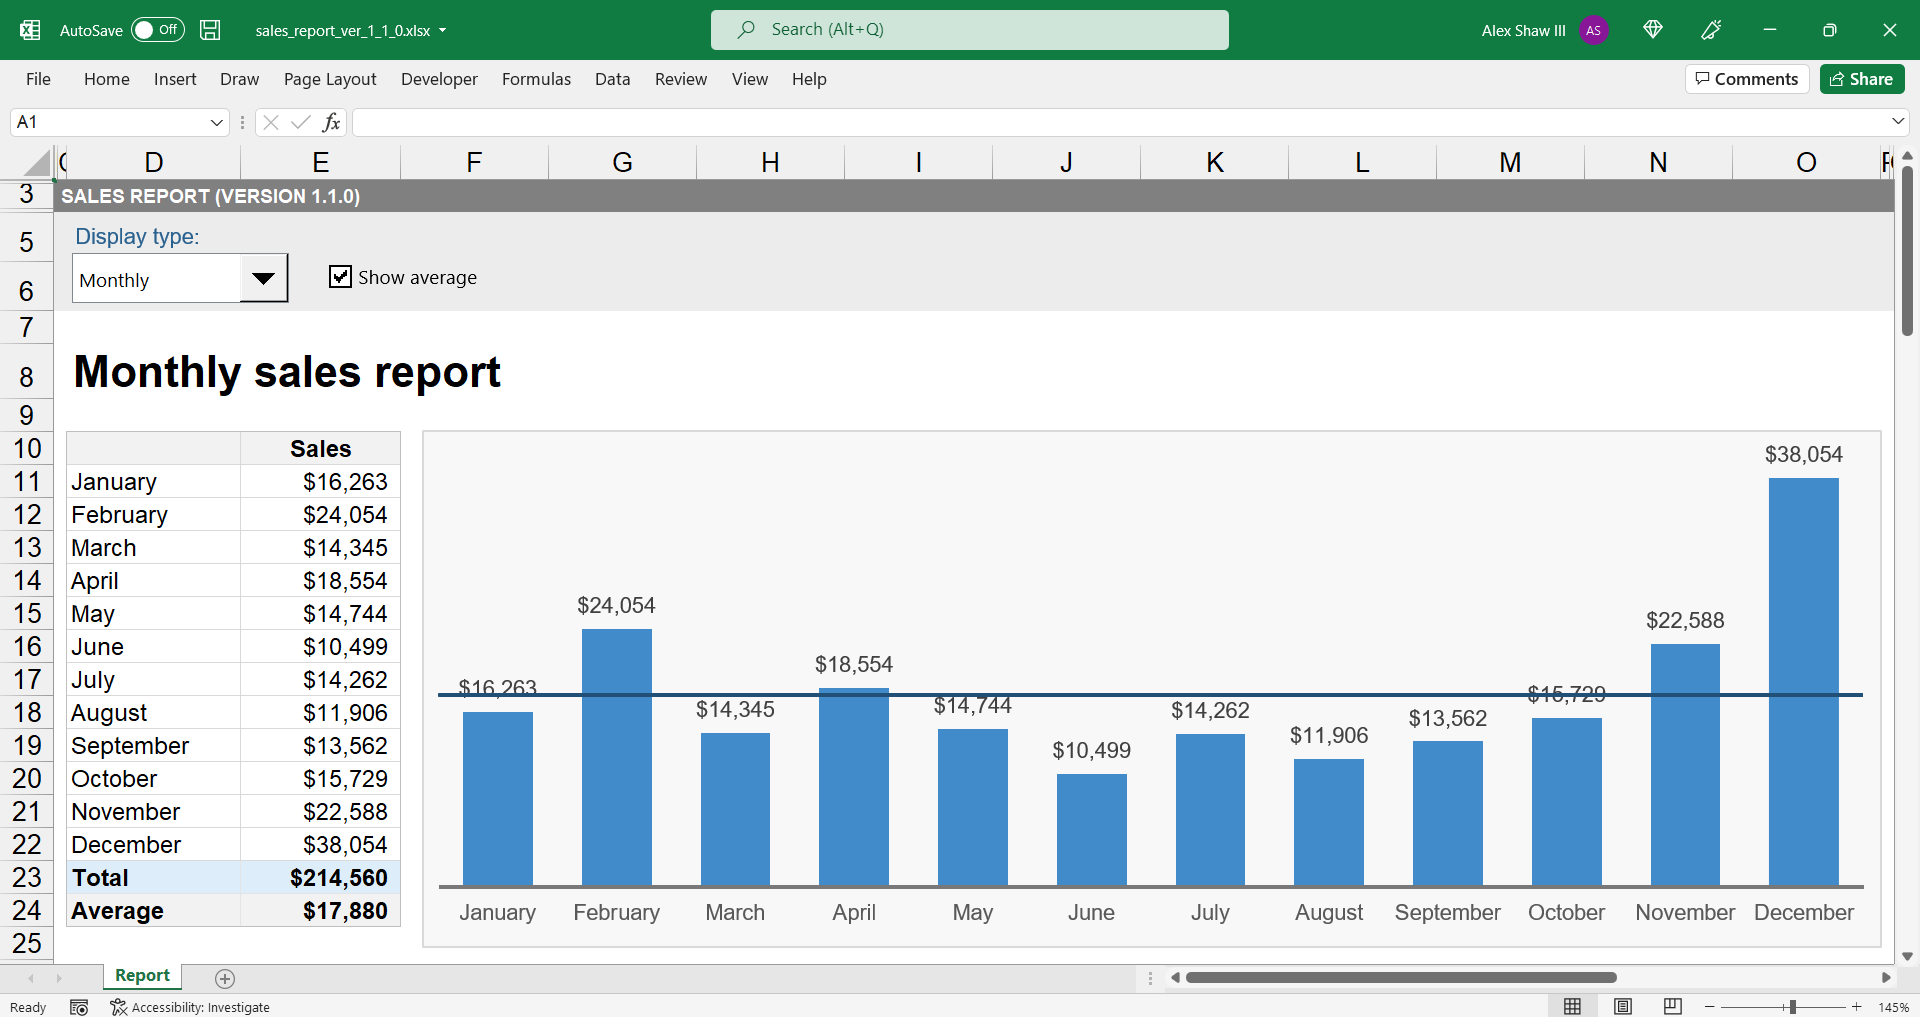
The Sales Reporting Dashboard (or SRD) is a basic reporting tool for Excel. Basically, it allows you to view your sales in monthly, quarterly, and six month formats. Also, it is an open source tool and free.
Requirements
Excel 2007 or higher or compatible
File size: 20 kB
Overview of the Sales Reporting Dashboard
Basically, to operate SRD, all you need to do is enter some monthly numbers and watch the SRD go. Also, keep in mind, all numbers are fake in this example.
By the way, you can use this tool for just about any kind of sales. It is up to you.
Note: If you make a selection or change a value, and it does not update, then you will need to press function key 9 (F9). Otherwise, turn on automatic calculations.
Features
- Show dashboard in monthly, quarterly, or six month increments
- Option to display an average line across a selected period
Download
Requirements: Excel 2007 or higher or compatible.
Click on the button below to download.
File size: 20 kB
Version information
When we update our tools, we like to maintain the previous versions. Thus, you will be able to access working versions of the SRD.
Below is version information for the SRD. Just click on a link to download a particular version.
- SRD 1.2.0 – June 7, 2022
Fixed average formula to not include zero sales in average calculation - SRD 1.1.0 – June 7, 2022
Added an option to display an average line across a selected period - SRD 1.0.0 – June 2, 2022
First version of the SRD