This quick snapshot shows you how to create target line for Excel charts. For the purpose of this quick tip, we will focus on column charts.
Snapshots to create target line for Excel charts
Since these are snapshots, we do not go in-depth on the entire process. Therefore we suggest you have some knowledge of Excel.
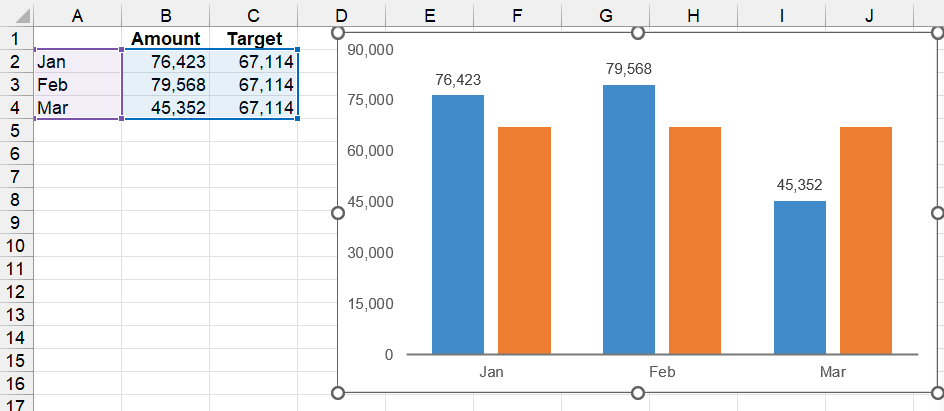
Create the column chart
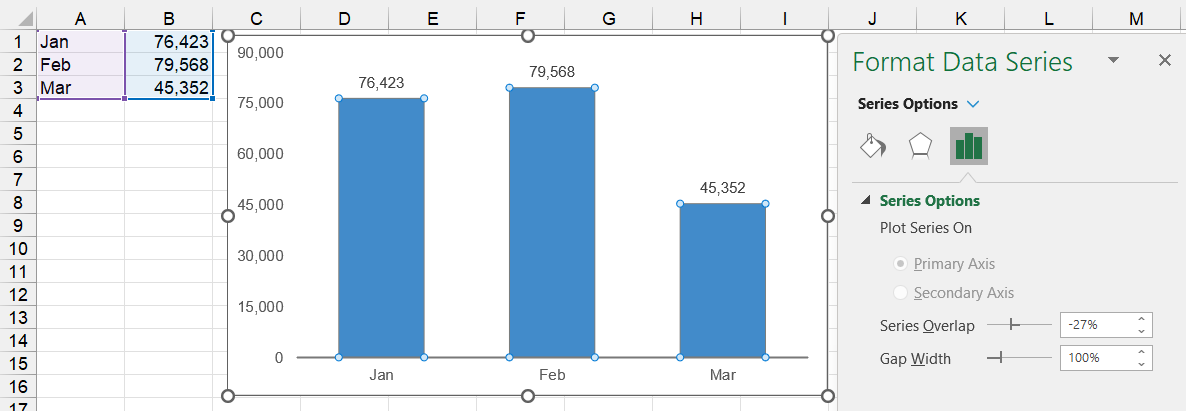
In addition to creating the chart, we made the Gap Width smaller, between columns. Now, the chart looks a little healthier. Generally, we like 70%. Later, we will work with the series overlap option.
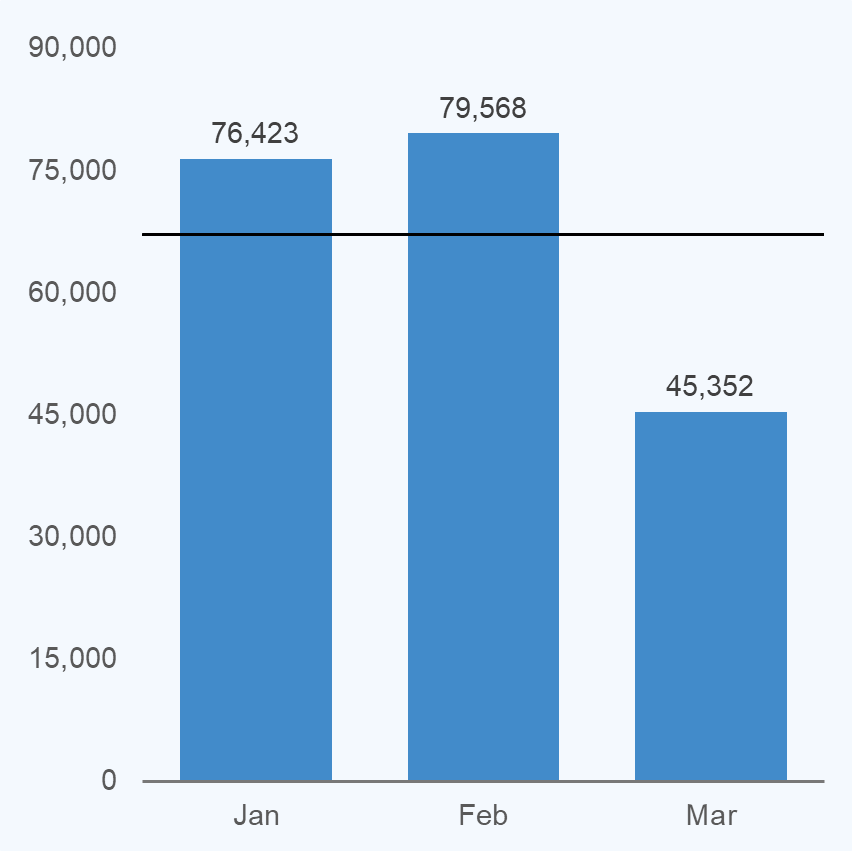
Add a series for the target line
For the target line, we are using the average for the three months. After that, we want to overlap the target column on top of the amount column.
Overlap target column
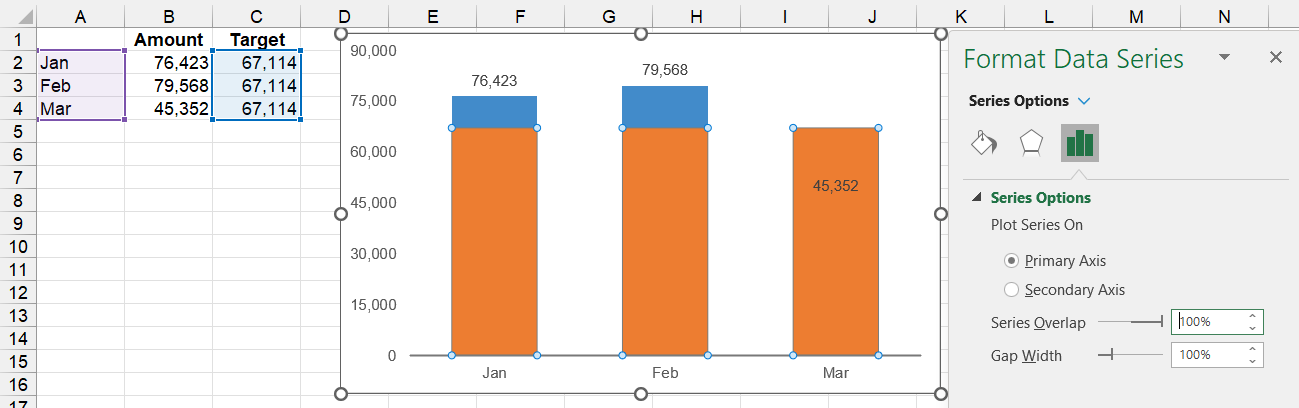
Change the Series Overlap to 100%. This will put the columns on top of each other.
Add the trendline
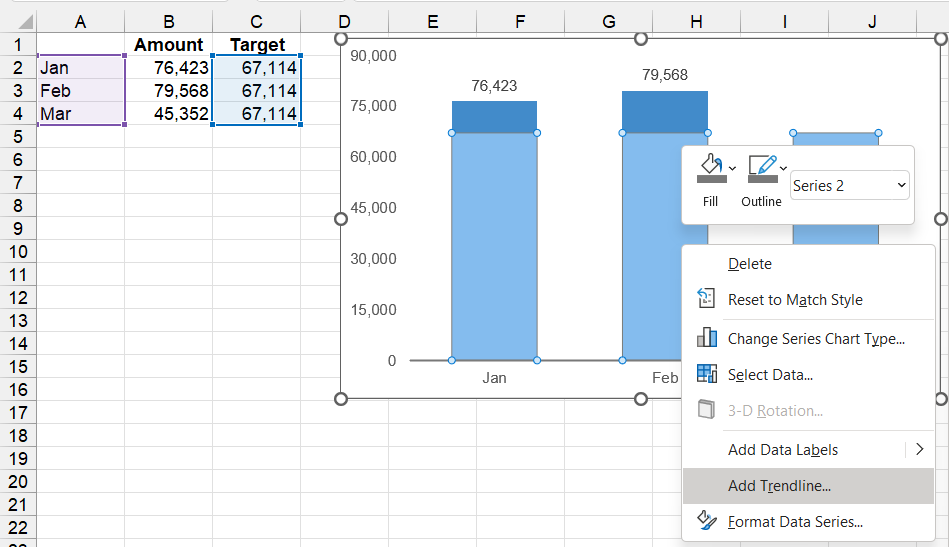
Just right-click with your mouse on the Target series, and select Add Trendline… from the shortcut menu. You can also click on the series and press keyboard shortcut Shift-F10. We do not discuss the long way here.
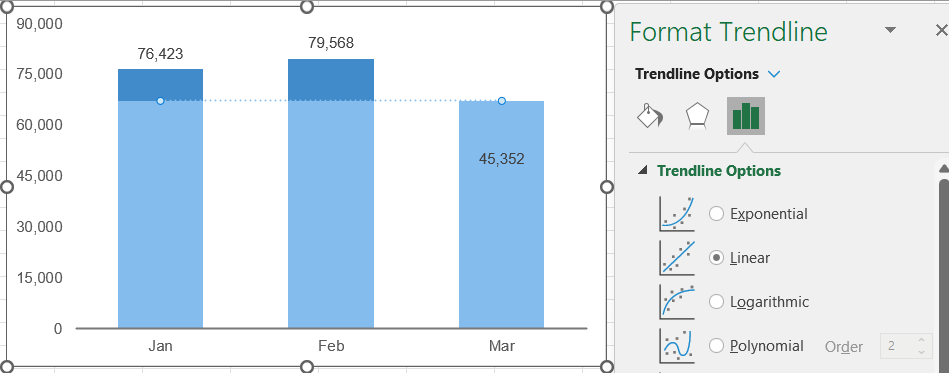
You may notice, your trendline may look faint, but it is there. Maybe, you should make it darker. For now, make sure you select Linear, under Trendline Options. This will keep the line straight. And, as long as all the numbers are the same, the trendline should be horizontal.
Stretch the trendline
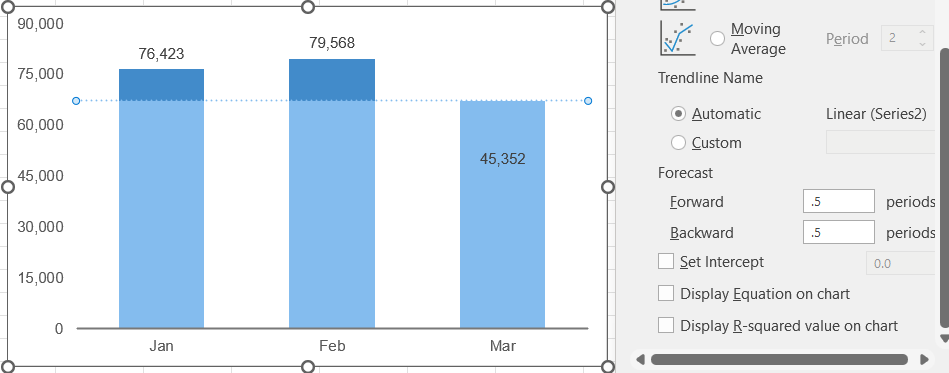
Select the trendline, and under Format Trendline, change the Forecast for both Forward and Backward to .5. After that, your trendline stretches across the entire plot area. Nice!
Hide the target column

To hide the target column, simply remove the fill and line color. You do not want to just click and delete. Most likely, your trendline will disappear too. Although we did not test that, we are pretty sure.
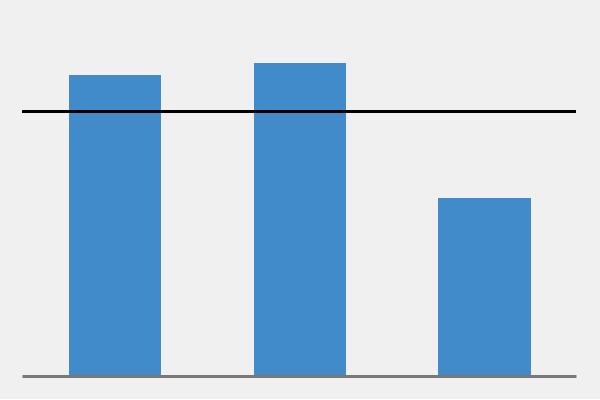
Finalize your target line
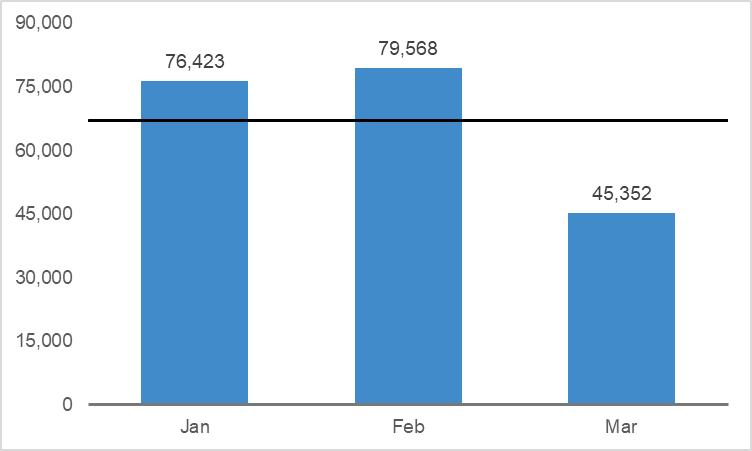
So, we made our target line a solid dark color. You can now format your line in any way you want. It is now part of the chart. Enjoy!
Success!
Were you able to do this just from the snapshots? If so, then great! If not, then try again.
Also, you can send us an email at support@techronology.com. Let us know what you thing, what you want to see, etc.
Related
- Add a holiday or special day to the Yearly Calendar
- Excel chart library
- Link cells to shapes in Excel – How to
- Protect Excel files with open password – Snapshots
- The S List